Week 11
Over the past few weeks I have been investigating which equations will be relevant to the project I want to build. In the lecture notes for for MAFTDSP I came across the equation for DSTFT.
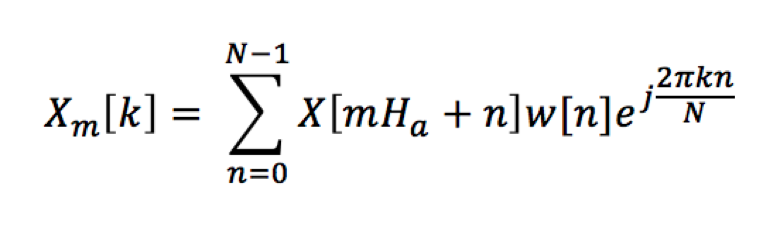
While intimidating to look at at first, what this formula outlines is a process where a signal is broken down into a series of shorter horizontal segments called ‘frames’, where each frame is then analysed according to a certain number of vertical frequency ‘bin’s.
Between reading through James McCellan’s, Ronald Schafer’s and Mark Yoder’s Signal Processing First and the lecture notes for MAFTDSP I have been able to teach myself the mechanics of the Fourier Transform in the context of the DSTFT. One concept that took me a while to grasp was how the complex exponential in each frequency bin interaction with the input signal. Windowing (or framing), frequency bins, hop size, etc. are all relatively straightforward insofar as you can pinpoint where they are on a waveform and to me to they are tied to it in a logical way. What was the hardest for me to grasp was the link between not only how a real and imaginary number create a ‘spinning’ complex exponential on the complex plane, but also how this exponential would indicate frequency levels of an input signal in certain bins. Similarly with phase information, I found being able to picture how the relatively abstracted process of wrapping the phase information between -π and π would be useful in signal reconstruction in Max
Perhaps somewhat ironically, or intuitively (depending on how you’re look at it), it was after studying Luke Dubois’ ‘jitter_pvoc_2D’ in Max’s example patches that I understood how these mathematical concepts were rendered in the Max environment.
The directory path where you can find Luke Dubois’ ‘jitter_pvoc_2D’: /Cycling ’74/Max 8/Examples/jitter-examples/audio/jitter_pvoc
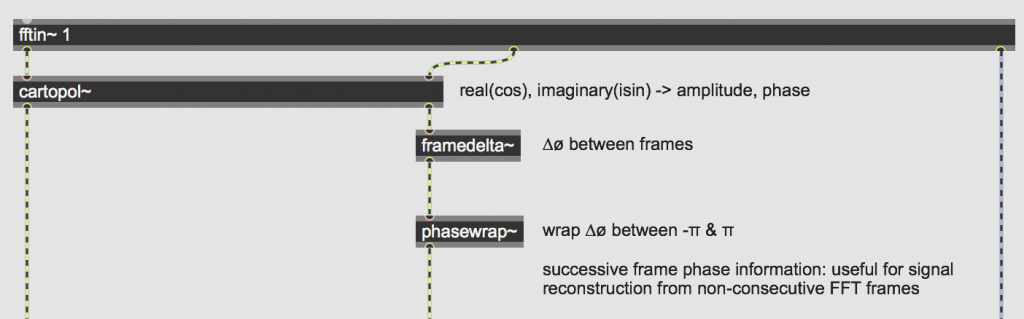
The ‘cartopol~’ object in the above image is what solidified my understanding of how a complex number (complex in the mathematical sense of being composed of real and imaginary values) could be processed by a computer. The idea of a computer or any physical system being able to process an imaginary number is completely non-sensical, and it was upon discovering the ‘cartopol~’ object that the process made sense to me.
For ‘framedelta~’ and ‘phasewrap~’ to operate, they must receive signal in tangible polar coordinate form. The object ‘cartopol~’ is necessary because in its pure form, Fourier Analysis of a signal outputs data in Cartesian coordinates, i.e. as as a coordinate in relation to real (cosine) and imaginary (sin) axis on the complex plane.
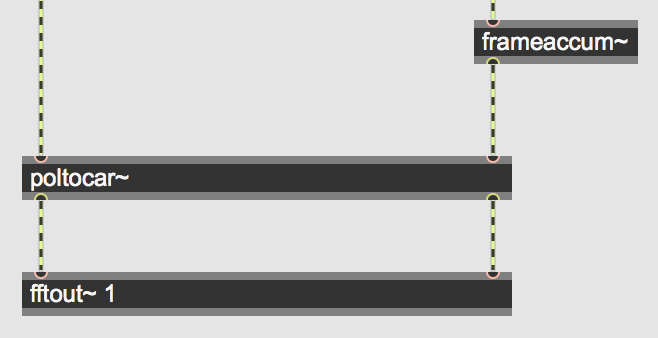
The concepts of running phase calculation, and frequency deviation were grounded in terms of my understandings in the ‘frameaccum~’ and ‘fftout~’ objects.